This is typically used for maintenance on an individual server, firewall, switch, or appliance.
Scheduling Down Time (SDT) Overview
SDT (Scheduled Down Time) allows you to temporarily suppress alerting in LogicMonitor. This is useful during planned maintenance, reboots, upgrades, backups, or any activity that would normally trigger alerts you expect and do not need to act on. SDT can be applied at the group, device, or datapoint level, depending on how wide you want the alert suppression to be.
SDT Levels Explained
Group-Level SDT Applying SDT at the group level suppresses all alerting for every device within that group. This is ideal for large-scale maintenance affecting multiple system, for example, patching a full server tier or performing network infrastructure updates.
Device-Level SDT
Device-level SDT suppresses alerting for all datapoints on a single device. This is typically used for maintenance on an individual server, firewall, switch, or appliance.
Datapoint-Level SDT
Datapoint-level SDT suppresses alerting for one specific datapoint. This is useful when a particular metric is known to spike during routine operations, such as CPU usage during backups or disk I/O during scheduled jobs.
How to Apply SDT
Below is an example of how the SDT tab looks and where the key options appear:
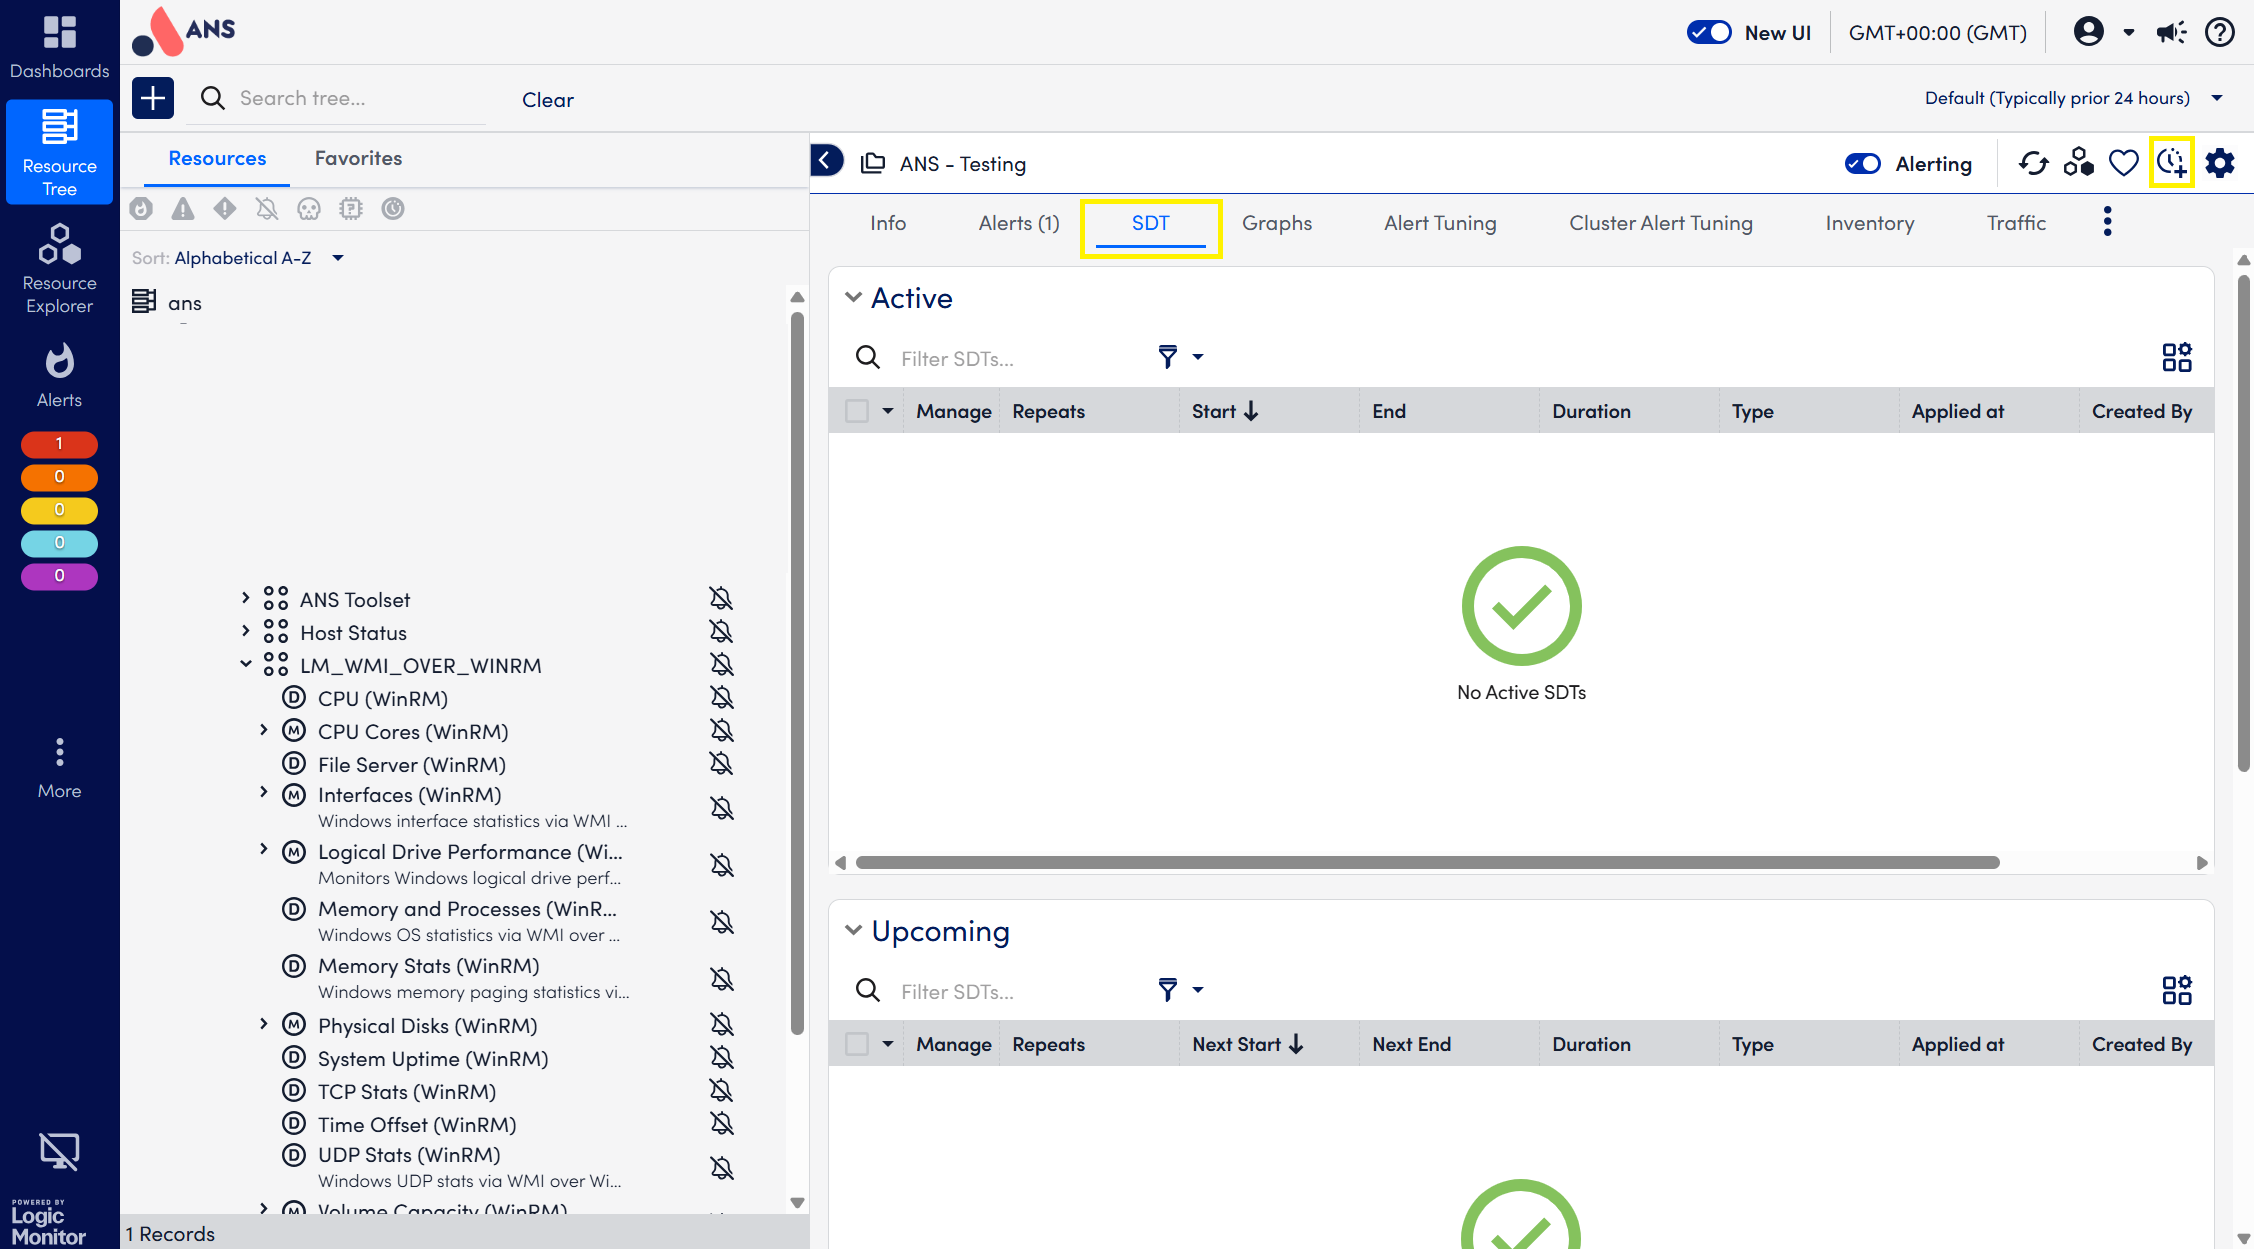
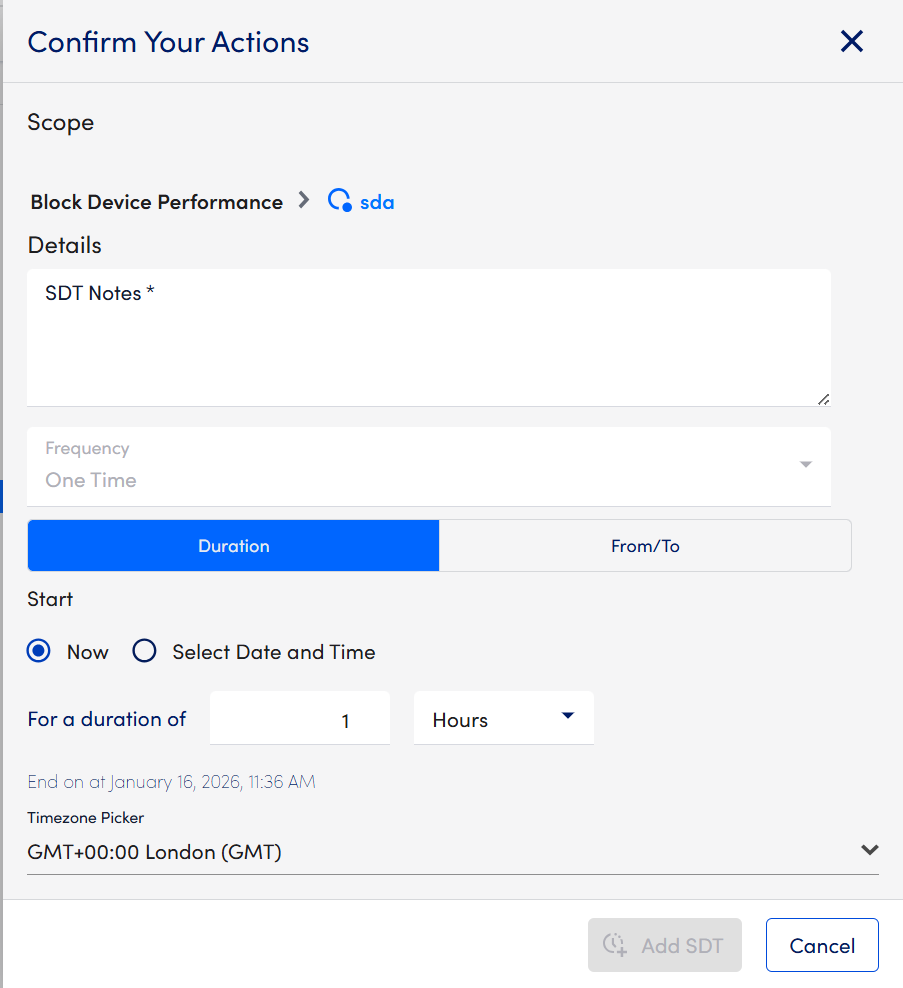
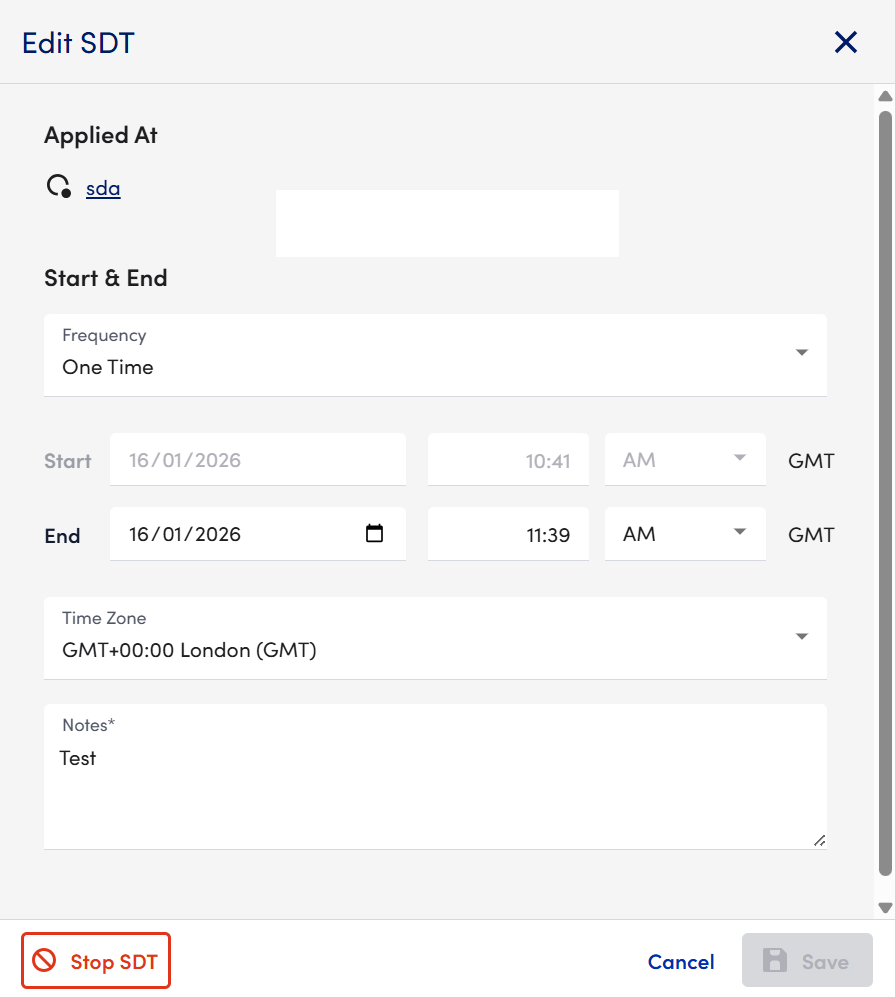
Clicking the (Schedule SDT) button opens a screen where you can define:
The start date and time The end date and time Whether this is a one-time event or a recurring schedule Which resource (group, device, or datapoint) the SDT applies to
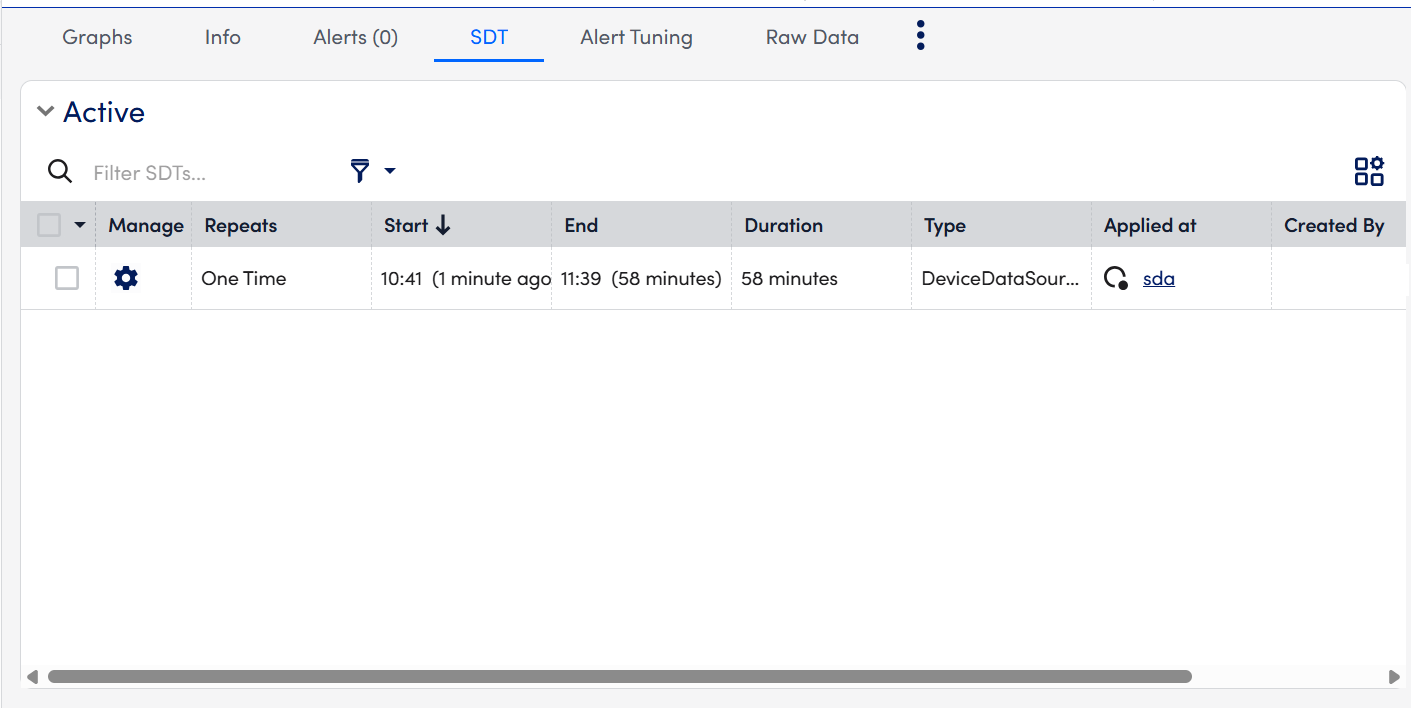
Once an SDT has been created, you can view and manage it from the SDT tab. This tab is divided into three section Active, Upcoming, and Historic which helps you clearly understand what maintenance periods are currently in effect, what is scheduled for the future, and what has already completed.
Active SDT Displays all SDTs that are currently running. These are the maintenance windows actively suppressing alerts on the selected group, device, or datapoint.
Upcoming SDT Shows any SDTs scheduled to start at a future date or time. This allows you to easily confirm that planned maintenance periods have been set correctly.
Historical SDT Lists all SDTs that have already ended. This is useful for reviewing previous maintenance activity or troubleshooting why alerts were suppressed at a certain time.
This layout provides a clear and convenient overview of all past, present, and scheduled alert suppression for the selected resource.
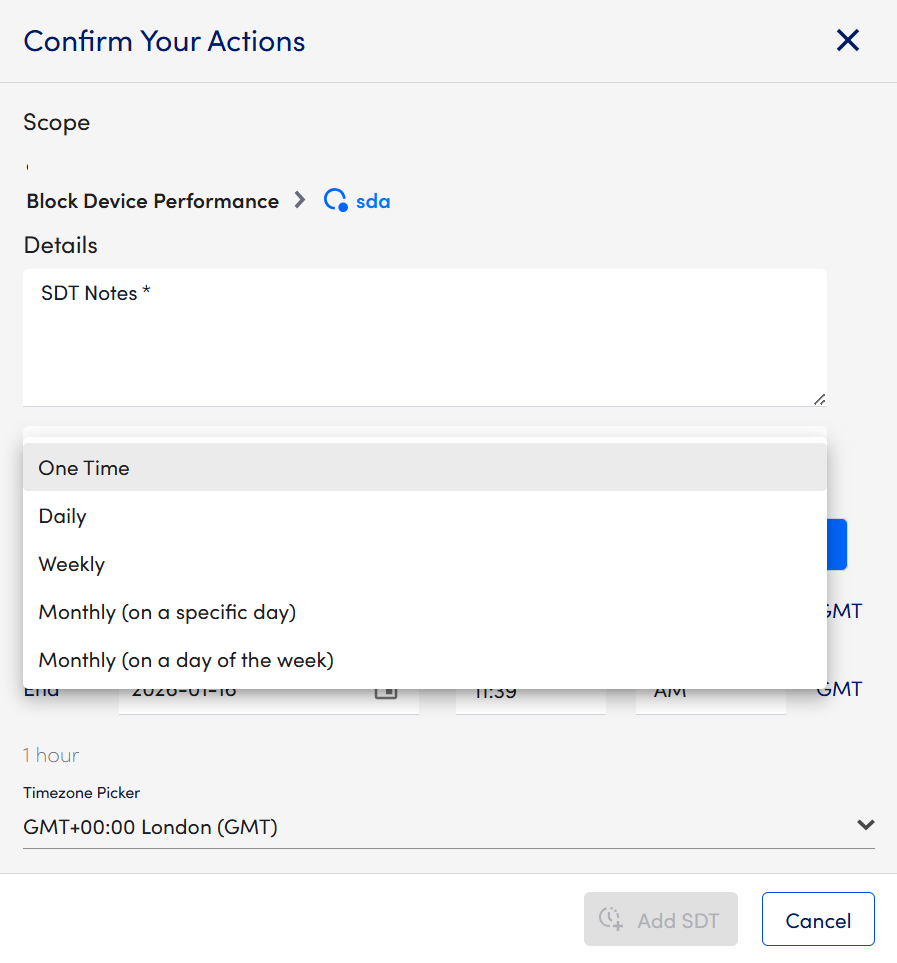
One-Time vs Recurring SDT
One-Time SDT is useful for temporary maintenance such as a one-off server reboot or software update happening at a specific time. Recurring SDT is ideal for preventing alerts during activities that happen regularly, such as:
Nightly or weekly backup jobs Regular batch processing tasks Recurring update windows Weekly maintenance routines
Using recurring SDT helps avoid alert noise from predictable, non-actionable events.
Managing and Deleting SDT
If an SDT is no longer needed, it can be removed easily. Open the SDT list, click the manage (cog) icon next to the entry, and choose the option to stop or delete the SDT.
This returns the device or group to normal alerting behaviour.
If you have any further queries please contact support